
How can I track wishlist performance?
Track wishlist performance at a glance
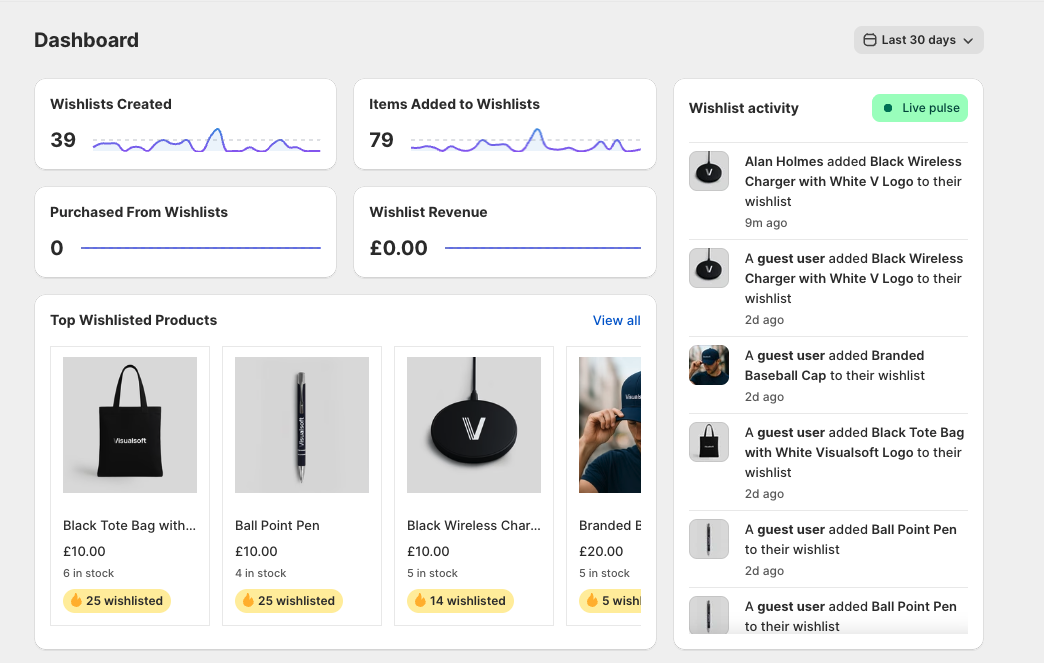
The Dashboard gives you a quick view of how shoppers are using wishlists and whether that interest is turning into sales. Use the date range in the top-right corner, such as Last 30 days, to keep all widget data in the same timeframe.
What to watch
- Wishlists Created: how many lists shoppers started.
- Items Added to Wishlists: how many products were saved.
- Purchased From Wishlists: how many saved items were later bought.
- Wishlist Revenue: revenue generated from wishlist-saved items.
- Top Wishlisted Products: the products getting the most saves.
- Wishlist activity: a recent feed of shopper actions, shown with Live pulse.
Use widgets for tracking
Use Top Wishlisted Products to spot demand early, especially for products customers save often but have not purchased yet. Select View all to review more product interest beyond the first visible items.
Use Wishlist activity when you want a quick read on recent engagement, such as customers adding products to their wishlist.
Track revenue over time
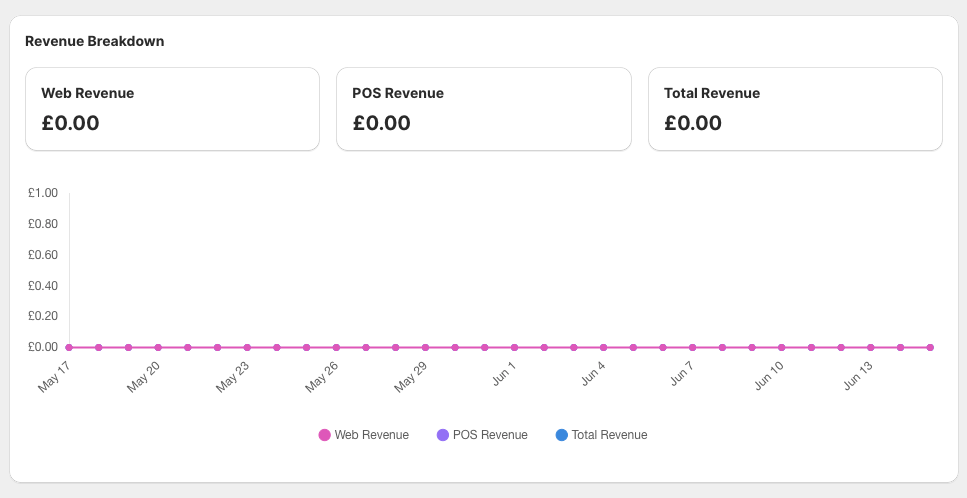
The Revenue Breakdown widget helps you follow wishlist-attributed sales across Web Revenue, POS Revenue, and Total Revenue. Use it to see whether saved products are contributing to revenue over the selected period.